

The window sticker says 35 mpg combined. You have a 15-gallon tank. Quick math: 525 miles per tank, plenty of cushion for a 1,000-mile weekend run with one fuel stop each way. The drive to the mountains begins on Friday afternoon, and somewhere around mile 280 the fuel gauge is at half and the math has already started to drift.
By the time the trip is over, you have stopped for fuel three times instead of two. The car averaged 28 mpg instead of 35. The extra fuel cost, extended over a summer of weekend trips, is real money — and none of it was visible on the window sticker.
Three factors are operating simultaneously on a highway road trip in an AWD crossover, and each of them pulls fuel economy away from the EPA estimate in a direction that compounds the others. The AWD system itself carries a fuel economy penalty that varies enormously — from less than 1 mpg on some vehicles to 7 mpg on others — and it is not always the number printed on the sticker for your trim. Highway speed above 65 mph increases aerodynamic drag nonlinearly, reducing real-world highway fuel economy below the EPA highway figure. And the practical variables — tire pressure, load weight, cargo positioning — add or subtract miles per gallon in ways that are entirely within your control before departure.
Understanding these three factors is not technical education. It is pre-trip planning with a direct dollar value.
Quick Takeaways
- The AWD fuel economy penalty varies dramatically by vehicle: the Kia Sportage Hybrid drops 7 mpg combined (42 → 35 mpg) from FWD to AWD; the Honda CR-V drops just 1 mpg combined (30 → 29 mpg); the difference between these two vehicles on a 1,000-mile trip is more than 5 gallons — approximately $18–$22 in fuel at current prices
- The EPA highway test is conducted at an average speed of approximately 48 mph, not 70 mph; at true Interstate cruise speed, aerodynamic drag increases with the square of velocity and real-world highway fuel economy typically runs 10–15 percent below the EPA highway figure for most crossovers
- AWD drivetrain components — the rear driveshaft, center differential, and rear axle — rotate continuously at highway speed even when the system is operating in front-wheel drive mode; this mechanical drag is the primary source of the AWD fuel economy penalty, regardless of whether AWD is actively engaged
- Tire pressure at 4 PSI below the recommended cold-inflation figure reduces fuel economy by approximately 1–2 mpg per NHTSA’s own testing — a penalty that compounds across the full trip length and is entirely fixable in five minutes before departure
- Increasing highway speed from 65 mph to 75 mph increases fuel consumption by approximately 12–15 percent — on a 500-mile one-way trip, that difference equals roughly 1.5–2 additional gallons of fuel; on a 1,000-mile round trip at $3.80/gallon, it costs approximately $11–$15 more in fuel per trip compared to 65 mph
- The pre-trip checklist items that directly affect fuel economy are: cold tire pressure check (morning of departure), cargo weight audit (remove items not needed for this trip), roof rack or box removal if not used (aerodynamic drag penalty documented at 5–15 percent highway MPG reduction), and realistic speed target
Factor 1: The AWD Penalty Is Not What You Think — And It Varies Enormously
Most buyers of AWD crossovers know there is a fuel economy penalty for the drivetrain. Most assume it is small and consistent across vehicles. Neither assumption is accurate.
CARFAX’s technical analysis of AWD fuel economy explains the mechanism: “All-wheel drive vehicles are generally less fuel-efficient than comparable front-wheel drive models due to the added weight of powertrain components and the extra friction that comes from two additional drive wheels. Many modern all-wheel drive systems rely on sensors that tell them when to power all four wheels. In most driving scenarios, such as on the highway, only the front wheels receive power, helping maximize fuel economy. Despite that, front-wheel drive vehicles are almost always more efficient because of their lighter weight and lower complexity.”
The key phrase is “the added weight of powertrain components and the extra friction.” The rear driveshaft, coupling unit, center differential, and rear differential all rotate at highway speed regardless of whether the rear wheels are being driven. This spinning hardware creates drag that the engine must overcome. The system may be predominantly sending power to the front wheels, but the rotating rear drivetrain components are always there, always adding friction.
The magnitude of this penalty varies significantly by how the AWD system is engineered and how much additional weight and mechanical complexity it adds:
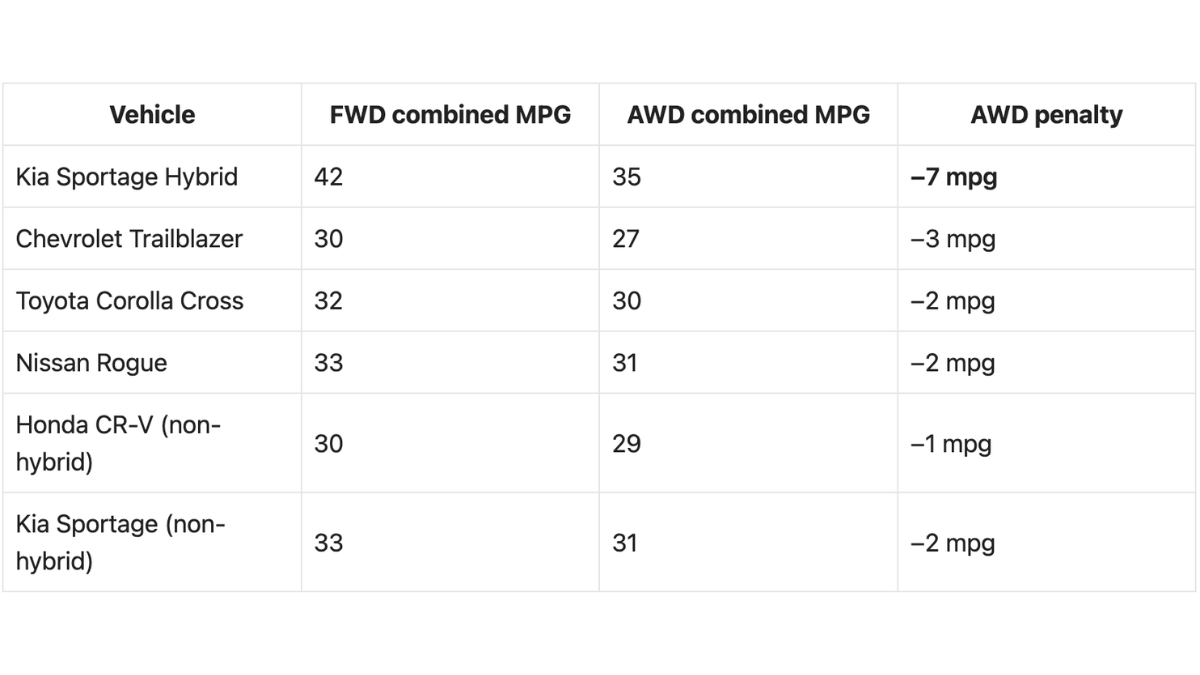
The Sportage Hybrid’s 7-mpg penalty stands out — and it has a specific cause. The Sportage Hybrid’s AWD system adds significant mechanical hardware to a vehicle already optimized for efficiency in FWD form. The rear electric motor system that provides AWD capability adds weight and complexity that the hybrid powertrain cannot fully offset. The result is that a Sportage Hybrid buyer who chooses AWD is paying a fuel economy penalty equivalent to switching from a fuel-efficient compact car to a conventional non-hybrid compact SUV, on combined driving.
On a 1,000-mile trip:
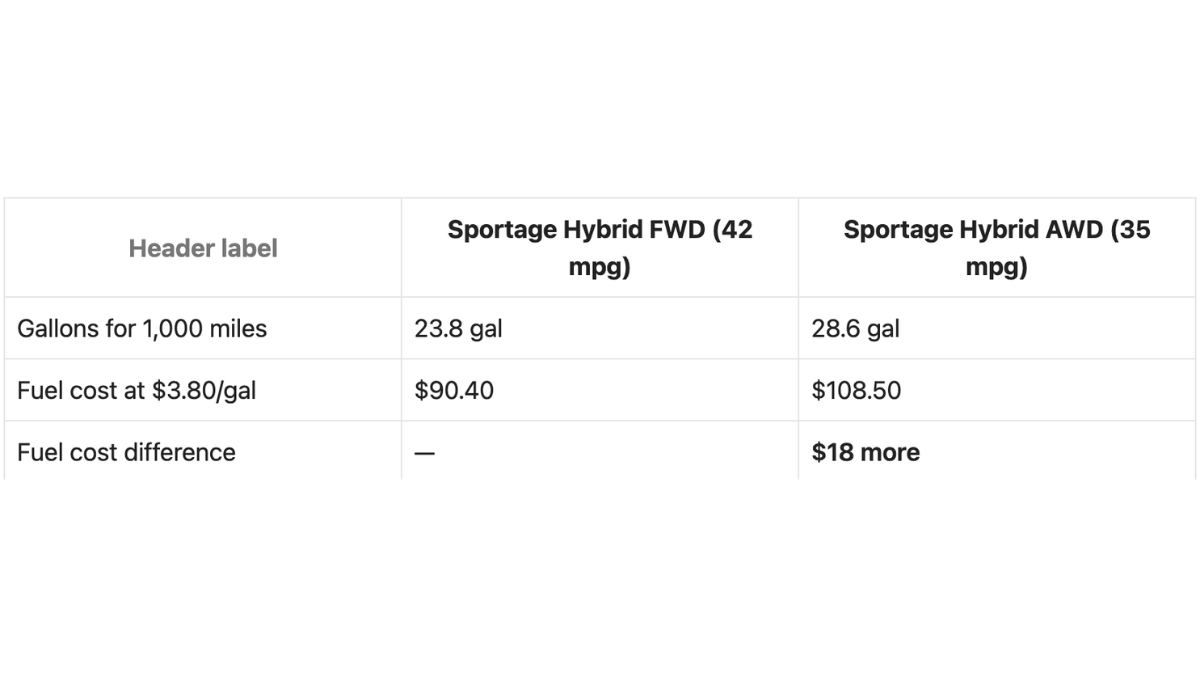
Over 15 weekend road trips per year of similar length, the Sportage Hybrid AWD owner spends approximately $270 more in annual fuel than the FWD owner of the same vehicle — in addition to the $1,500–$2,000 AWD purchase premium.
For the CR-V’s 1-mpg penalty, the same 1,000-mile comparison produces a fuel cost difference of approximately $1.28 per trip. The engineering matters enormously.
Factor 2: The EPA Number Is a 48 MPH Number
The EPA highway fuel economy figure is not a 70-mph number. The EPA highway test cycle averages approximately 48 mph, includes acceleration and deceleration phases, and reaches a maximum speed of 60 mph during the cycle. It does not represent sustained 70–75 mph Interstate cruise at the speed most road trippers actually travel.
At higher speeds, aerodynamic drag increases with the square of velocity. Traveling at 75 mph instead of 65 mph does not produce a 15 percent increase in drag — it produces approximately a 33 percent increase in aerodynamic resistance, because the drag force scales with the square of speed. Most of a crossover SUV’s fuel consumption at highway speed is spent overcoming aerodynamic drag, not rolling resistance or drivetrain friction. Increasing speed meaningfully increases the fuel burned per mile in a nonlinear way.
The U.S. Department of Energy’s fueleconomy.gov documents this directly: fuel economy typically decreases rapidly above 50 mph, with each 5 mph over 50 mph equivalent to paying roughly $0.18–$0.22 more per gallon of fuel. The agency’s estimate: driving at 70 mph instead of 55 mph uses roughly 14 percent more fuel. Driving at 75 mph uses roughly 20–23 percent more fuel than 55 mph.
Applied to the real world of a 1,000-mile weekend trip: a driver averaging 72 mph in a crossover rated at 32 mpg highway (at EPA test conditions) will likely see real-world highway economy of approximately 27–29 mpg — 10–15 percent below the sticker. This is not a manufacturer deception; it is physics at a speed the EPA test was not designed to capture.
The practical implication: on a 1,000-mile trip, use 80 percent of the EPA highway figure as your planning estimate if you drive at or above 70 mph consistently. For a vehicle rated 35 mpg highway, plan fuel stops around 28 mpg effective. This prevents the “math stops working” moment at mile 280.
Factor 3: The Variables Entirely Within Your Control
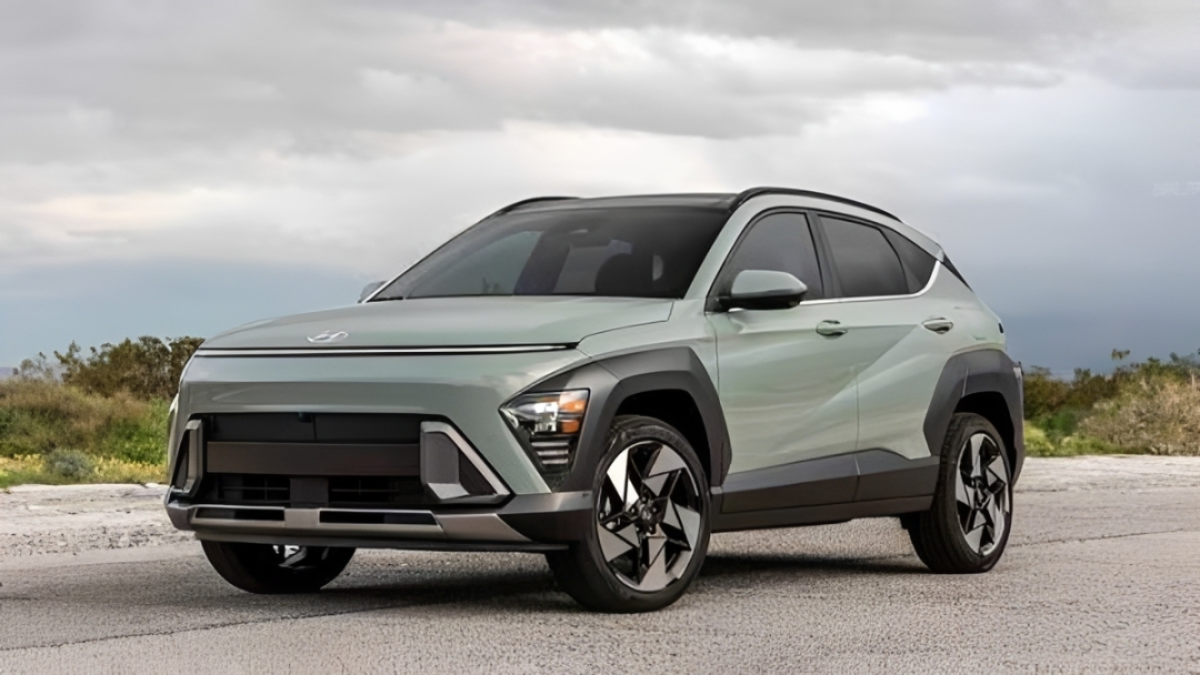
The AWD system’s mechanical drag and the highway-speed drag penalty are inherent to the vehicle and the trip. Three other fuel economy variables are entirely controllable before departure.
Tire pressure. NHTSA’s fuel economy data confirms that tires underinflated by 4 PSI reduce fuel economy by approximately 1–2 mpg. For a family that last checked tire pressure three months ago, this gap may already exist before departure. Tires lose approximately 1 PSI per month in normal conditions and 1 PSI per 10°F drop in ambient temperature. A vehicle that was correctly inflated in August and is departing for a fall trip on a 50°F morning may already be 3–4 PSI low.
The check: tire pressure cold (before the car has been driven that day, not after morning warm-up when tires temporarily show higher pressure). Use the door placard specification, not the maximum pressure molded into the tire sidewall. Takes three minutes with a $10 gauge that lives in the glove box.
Roof rack and cargo box drag. A factory crossbar roof rack generates measurable aerodynamic drag at highway speed even when empty — documented at approximately 3 percent fuel economy reduction per Car & Driver testing. A cargo box mounted on roof rails produces significantly more: the NREL’s research on aerodynamic accessories documented fuel economy reductions of 5–15 percent for rooftop cargo carriers at highway speed, depending on box shape, mounting position, and vehicle design.
For a 1,000-mile trip in a vehicle rated 32 mpg highway: a cargo box that reduces highway economy by 10 percent costs approximately 3.2 mpg — equivalent to 10 additional gallons of fuel over the trip, or approximately $38 at current prices. If the cargo box is not needed for this trip, removing it before departure is the highest-return pre-trip fuel economy action available.
Cargo weight. Every 100 pounds of additional vehicle weight reduces fuel economy by approximately 1 percent per the U.S. Department of Energy. A fully loaded family crossover with four passengers, a full cargo area, and roof-mounted equipment can easily add 600–800 pounds over the vehicle’s base curb weight. At 1 percent per 100 pounds, that represents a 6–8 percent fuel economy reduction from passenger and cargo load alone — approximately 2–2.5 mpg on a 32-mpg vehicle.
This is not an argument for traveling without luggage. It is an argument for auditing what is already in the vehicle before departure — the golf clubs from last weekend, the sand chairs from last summer, the emergency kit that has grown to 40 pounds of unreviewed items in the cargo floor. Removing items that will not be used on this specific trip costs nothing and adds range.
The Pre-Trip MPG Checklist
Five items, all executable in 20 minutes the morning of departure:
1. Cold tire pressure. Check all four tires against the door placard specification before driving. Add air if any tire is more than 2 PSI below specification. Takes three minutes.
2. Roof rack and box audit. Is the roof-mounted equipment needed for this trip? If not, the crossbars take two minutes to remove on most factory rack systems. The cargo box, if present and not needed, removes in approximately five minutes. Fuel economy improvement: 3–12 percent at highway speed.
3. Cargo audit. Open the cargo area and physically identify what is there. Remove items not needed for this trip. Common finds: sports equipment, emergency supplies that have accumulated excess weight, returnable items that never made it back. Fuel economy improvement: 1–3 percent per 100 lbs removed.
4. Recalculate range using 80 percent of EPA highway figure. If the vehicle is rated at 35 mpg highway, plan fuel stops at 28 mpg effective range. For a 13-gallon usable tank: plan to refuel every 350 miles, not every 450. This eliminates the range anxiety that causes drivers to refuel from nearly full tanks or push ranges uncomfortably.
5. Set a highway cruise target. A 70 mph cruise versus a 75–77 mph cruise on a 500-mile one-way leg uses approximately 1.5–2 more gallons in the faster scenario. Over a 1,000-mile round trip at $3.80/gallon, that is $11–$15 per trip. Over 15 annual weekend trips, the cumulative difference is $165–$225 — approximately the same as the fuel cost of the Sportage Hybrid AWD versus FWD penalty described earlier.
The AWD Penalty Table — Pre-Purchase Version
For buyers still choosing between FWD and AWD: the AWD decision for fuel economy purposes should be made with the model-specific penalty, not an assumed 1–2 mpg generic reduction. The variance between models is large enough to change the math materially.
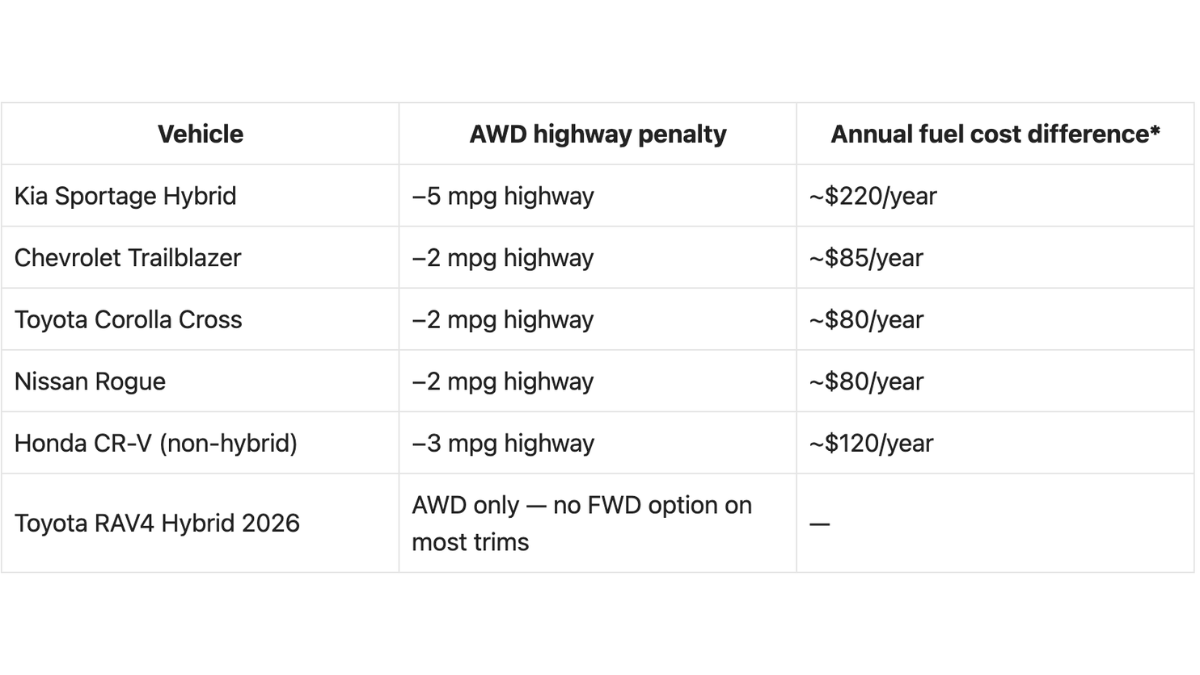
*Based on 15,000 miles/year at 60 percent highway at $3.80/gallon. Verify at fueleconomy.gov for your specific trim.
CARFAX summarizes the purchase decision correctly: “All-wheel drive affects acceleration, not braking. The added grip from two extra drive wheels doesn’t help with stopping, leaving the brakes and tires to do the work.” For buyers who believe AWD primarily helps them stop on slippery roads: it does not. AWD is a traction device for getting started and maintaining motion. Winter tires help both acceleration traction and stopping distance. The combination of FWD plus winter tires outperforms AWD plus all-season tires in stopping performance on ice and packed snow — relevant for buyers choosing AWD specifically for winter safety.
U.S. and Canada Note
In U.S. northern markets and throughout Canada, AWD crossovers are purchased at substantially higher rates than in southern states — reflecting the genuine traction value in winter conditions. The fuel economy penalty described above applies year-round, not only in winter. A Canadian family driving a Sportage Hybrid AWD in Ontario or Alberta pays the 7-mpg combined penalty in July as much as in February.
Tire pressure is particularly relevant in Canadian winters: ambient temperatures of -15°C to -25°C produce a tire pressure loss of approximately 5–7 PSI from a summer baseline at 20°C. A vehicle correctly inflated in September may be running 6–8 PSI low by January, producing both a fuel economy penalty and a handling degradation before winter tires are factored in. The pre-trip tire pressure check is more consequential in cold-climate markets than in temperate ones, and applies to winter tire sets as well as summer and all-season rubber.
SOURCES
- CARFAX AWD vs. FWD analysis: AWD penalty from added weight and friction; components rotate continuously even when system operating in FWD mode; 2026 CR-V AWD $1,500 more and 1 mpg less than FWD; Corolla Cross AWD $1,300 more and 2 mpg less; “AWD affects acceleration, not braking”; FWD lighter and simpler, almost always more efficient
- CarGurus: Kia Sportage Hybrid FWD 42 mpg combined → AWD 35 mpg combined (7 mpg penalty); Nissan Rogue FWD 33 → AWD 31; Trailblazer FWD 30 → AWD 27; “opting for AWD almost always results in a slight decrease in fuel economy — the difference varies by model”
- U.S. News best-mpg SUVs 2026: CR-V Hybrid FWD 43/36/40 mpg → AWD 40/34/37; Corolla Cross FWD 32 combined → AWD 30; Lexus UX Hybrid FWD 43 → AWD 42 [1 mpg only]; trim-level fuel economy comparison table for current model year
- U.S. DOE/EPA fueleconomy.gov driving habits guide: fuel economy decreases rapidly above 50 mph; each 5 mph over 50 mph equivalent to paying ~$0.18–$0.22/gallon more; driving at 70 mph vs. 55 mph uses ~14% more fuel; aggressive driving lowers fuel economy 10–40%; tire inflation at recommended pressure improves fuel economy up to 3%
- NHTSA tire safety campaign: underinflated tires reduce fuel economy 0.2–0.3% per PSI below recommended; tires lose ~1 PSI per month and 1 PSI per 10°F temperature drop; door placard specification is the correct reference, not tire sidewall maximum
- NREL aerodynamic accessories study: rooftop cargo carriers reduce highway fuel economy 5–15% depending on box shape and vehicle; empty crossbars add approximately 3% drag; cargo positioning and shape affect penalty magnitude; documented at highway cruise conditions